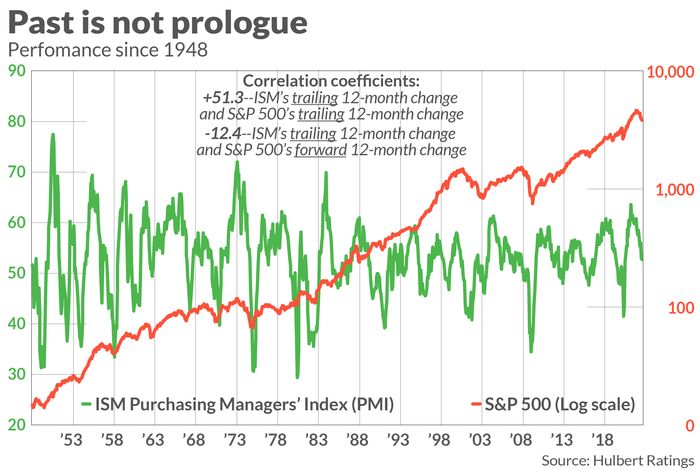
I’m not saying the bear market is over. But if U.S. stocks continue to slide, don’t blame the ISM’s recent decline.
The Institute for Supply Management’s manufacturing index — the ISM Index — is otherwise known as the manufacturing purchasing managers index, or PMI. The ISM reflects the results of a monthly survey of purchasing managers at hundreds of U.S. manufacturing firms.
Economic calendar: Nonfarm payrolls and unemployment data due Friday, along with a consumer-credit update and more
This key indicator of economic health is currently at 52.8 — down from as high as 63.7 in early 2021, and at its lowest level since the early days of the COVID-19 pandemic lockdown. As my MarketWatch colleague Jeffry Bartash reported, this latest reading is “a sign of creeping weakness in the U.S. economy.”
Many bears have pounced on this latest reading as a reason to expect further weakness in coming months. They point out, with substantial historical supporting evidence, that corporate earnings tend to follow the lead of the ISM index with a several month time lag.
But that most definitely does not mean equities will follow. The stock market’s current level already incorporates the bad earnings significance of the ISM’s latest report. The bears’ argument would be justified only if they could show that the market systematically ignores or misinterprets that significance.
Yet there is no such evidence. Consider what I found upon measuring the correlation between the ISM index and the S&P 500 Index
SPX,
When focusing on contemporaneous changes in these two indices, I found a significant positive correlation coefficient — 51.3% when correlating trailing 12-month percentage changes since 1948, as you can see from the chart below. This is exactly what you’d expect from an efficient stock market, rising and falling in synch with measures of economic activity.

In contrast, when correlating the ISM’s trailing 12-month percentage change with the S&P 500’s percentage change over the subsequent 12 months, the correlation coefficient turned negative — minus 12.4%, to be exact. This inverse correlation means that more often than not, the stock market turns in above-average performance following big drops in the ISM index — and vice versa.
To be sure, this inverse correlation is only marginally statistically significant. So it would be going too far to conclude that the ISM’s recent plunge is actually good news for the stock market. But the fact that it is even inverse at all shows that the stock market more or less immediately incorporates the full economic significance of new ISM readings and, if anything, slightly overreacts.
No one is arguing that the U.S. economy isn’t weaker than it was in 2021. It undeniably is. But that weakness is already incorporated in stock prices. The future course of the stock market will be a function of whether the economy in coming months is stronger or weaker than currently anticipated.
Mark Hulbert is a regular contributor to MarketWatch. His Hulbert Ratings tracks investment newsletters that pay a flat fee to be audited. He can be reached at [email protected]
More: Most U.S. businesses grow faster in July, ISM finds, in sign of resilient economy
Also read: FAANGs ain’t what they used to be, so beware the bear-market bounce says this hedge fund manager
