
The stock market has returned to an extremely bearish phase, as it has been making new yearly lows. This pattern of lower highs and lower lows, in stock prices, defines a bear market. Because of that, one should maintain a “core” bearish position.
Recent activity at the beginning of October had offered some potential hope for the bulls, as oversold conditions in the S&P 500
SPX,
became buy signals in a few cases. Those were quashed by this latest return to new lows, though, and so it’s back to the drawing board in terms of setting up new buy signals from lower levels.
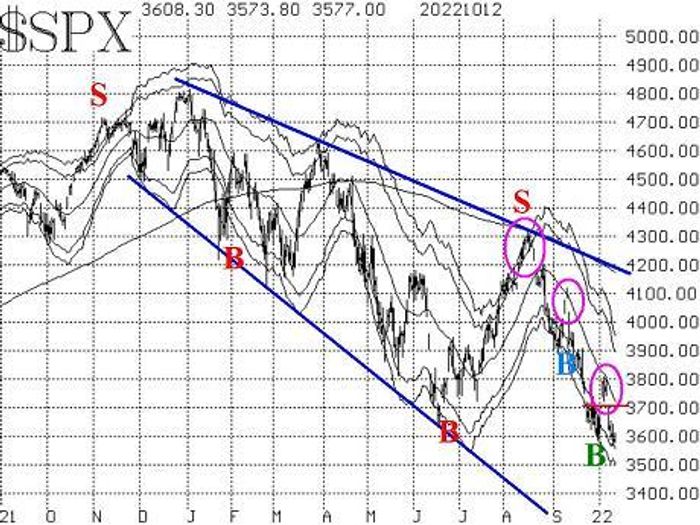
Not only has SPX made new lows, but there is now a third island reversal on its chart (the circles on the accompanying SPX chart, above). These are rare for an index chart and are quite bearish.
The first major resistance area is 3700-3750 points, which is the first gap on the chart (created when the third island reversal was formed). As for support, one has to go back to the fall of 2020 to find prices that were this low, and when support is that old, it is tenuous, at best. There is theoretically support near 3500.
The McMillan Volatility Band (MVB) buy signal is still in place (green “B” on chart), and it would be stopped out if SPX were to close below the -4σ “modified Bollinger Band.”
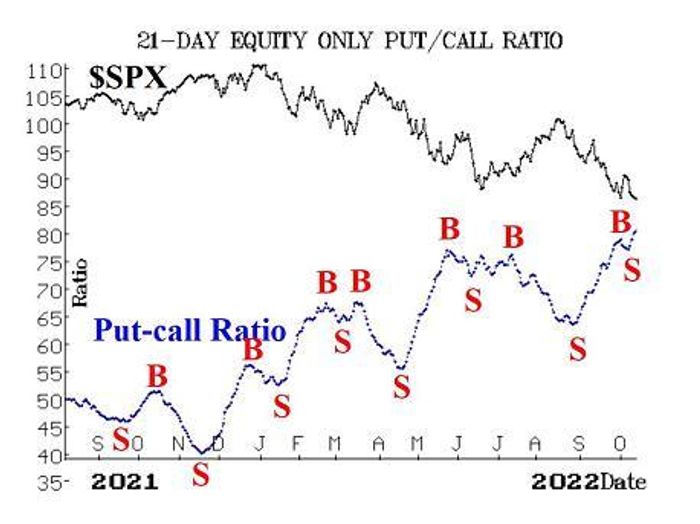
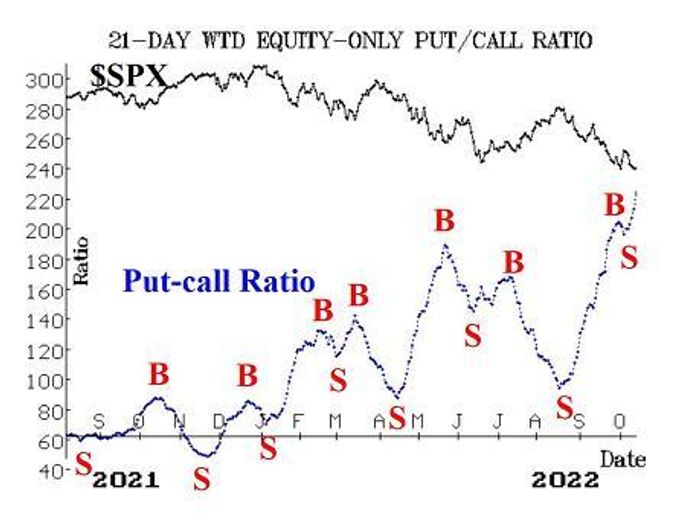
Equity-only put-call ratios are pushing to new 2022 highs, reaching levels last seen in March and April of 2020. That makes them oversold, but still on sell signals. Buy signals would only be formed if they roll over and begin to trend downward. It had appeared that they were doing so at the beginning of October, but that was canceled out when they moved to new yearly highs. Also, the total put-call ratio is making new highs, so it has not generated a buy signal yet, either.
Market breadth has been extremely negative, and so both breadth oscillators remain on sell signals. They are in oversold territory, of course, but that does not mean one should buy the market based on that. One needs to wait for confirmed buy signals, which are not going to occur here right away. It’s going to take two or three days of positive breadth in order to roll these oscillators over to buy signals.
New highs on the NYSE numbered only eight yesterday, so the “new highs vs. new lows” indicator remains mired on a sell signal, as it has since April.
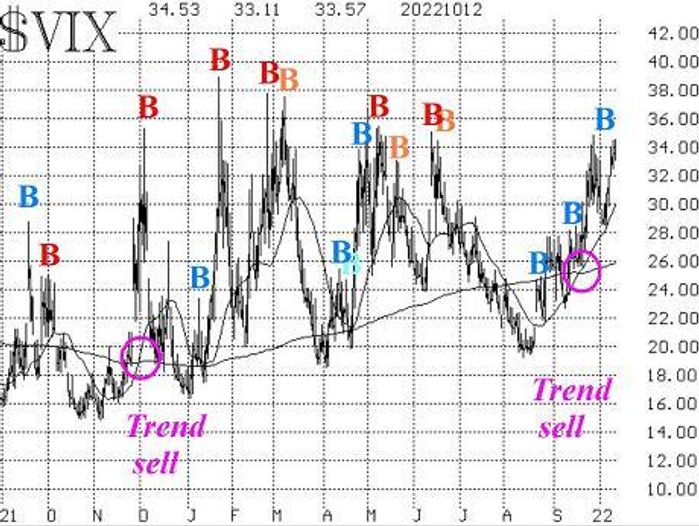
VIX has been pushing slowly higher, although it has not made a new high for the year. Even so, the trend of VIX sell signal remains in place and will do so as long as VIX continues to close above its 200-day moving average (MA). That MA is at 26 and rising, so VIX is well above that.
On perhaps a more positive note, another VIX “spike peak” buy signal is setting up, since VIX is “spiking” higher. That buy signal will occur when VIX closes at least 3.00 points lower that its highest price. So far that highest price that has been reached on this most recent move is 34.53 on Oct. 12. Somewhat surprisingly, SPX had sold off sharply earlier Thursday on the CPI numbers, yet VIX was basically unchanged.
The construct of volatility derivatives has been modestly negative over the past few weeks. That is, the term structures of both the VIX futures and of the CBOE Volatility Indices are sloping downwards in the front end of the “curve.” So far, this has not reached levels that would be considered to be major sell signals, but it is still a negative to see October (front-month) VIX futures trading above the price of November VIX futures.
In summary, we continue to maintain a “core” bearish position and will trade confirmed buy signals around that if and when they occur.
New recommendation: Potential “VIX crossover” buy signal
VIX has been trading higher than VIX3M in recent days. This is an inversion to the term structure of the CBOE Volatility Indices and represents an oversold condition. When it reverts to normal, a buy signal occurs. That is, when VIX closes back below VIX3M, that is a short-term buy signal that typically produces its best results in the first five trading days.
IF VIX closes below the price of VIX3M,
THEN Buy 1 SPY Nov (18th) at-the-money call
And Sell 1 SPY Nov (18th) call with a striking price 20 points higher.
After the position is established, stop yourself out if VIX closes back above VIX3M for two consecutive days. Otherwise, exit the position after five trading days.
New recommendation: Potential VIX “spike peak” buy signal
These signals have not been successful recently but have been stopped out quickly. The blue “Bs” on the VIX chart above show those losing trades. This trading system has a long and profitable track record, though, so we will continue to employ it.
IF VIX closes at least 3.00 points below its most recent high of October 12th and later,
THEN Buy 1 SPY Nov (18th) at-the-money call
And Sell 1 SPY Nov (18th) call with a striking price 20 points higher.
If established, then we will hold for 22 trading days (about a month). Stop yourself out if VIX closes above that “most recent high” price.
Follow-up action:
All stops are mental closing stops unless otherwise noted.
We are using a “standard” rolling procedure for our SPY spreads: in any vertical bull or bear spread, if the underlying hits the short strike, then roll the entire spread. That would be roll up in the case of a call bull spread, or roll down in the case of a bear put spread. Stay in the same expiration, and keep the distance between the strikes the same unless otherwise instructed.
Long 1 SPY Oct (21st) 377 put and Short 1 SPY Oct (21st) 347 put: this is our “core” bearish position. Previously, it was twice rolled down 30 points on each strike (per our general rule of “rolling” stated above). Since it is now 20 points in-the-money on the long puts and expiration is just a week away, roll the entire spread down and out: sell the spread you currently own, and buy 1 SPY Nov (18th) at-the-money put and Sell 1 SPY Nov (18th) put with a striking price 30 points lower. NOTE: if there is no strike 30 points lower, then use the nearest one to 30 points lower.
Long 6 CANO Oct (21st) 7 calls: option volume in CANO has elevated again, riding the momentum of rumors related to possible takeover interest by CVS, HUM and others. A Citi analyst recently estimated a possible takeover price as high as $14 for CANO. Raise the stop to 8.25.
Long 2 BFB Oct (21st) 65 puts: since BFB traded at 65, we rolled down to the Oct (21st) 65 puts, per the instructions from last week’s report. We will hold these puts as long as the BFB put-call ratio is on a sell signal.
Long 1 SPY Oct (28th) 391 and Long 1 SPY Oct (28th) 366 put: this started out as the long 391 straddle; then we rolled the Oct (28th) 391 put down to the Oct (28th) 366 put. Continue to hold without a stop for now. Roll the put down again if SPY trades at 346.
Long 1 SPY Oct (28th) 377 put and Short 1 SPY Oct (28th) 352 put: this spread was bought in line with the trend of VIX sell signal. stop yourself out if VIX closes below 25 for two consecutive days. This spread is also 20 points in-the-money, so roll both sides down by 20 points, staying in the October 28th expiration.
Long 1 SPY Oct (28th) 372 call and Short 1 SPY Oct (28th) 387 call: this spread was bought in line with the $VIX “spike peak” buy signal. VIX returned to “spiking mode” on October 10th, so the spread should have been exited at that time. If you did not do so then, exit now.
Long 1 SPY Nov (18th) 376 call and Short 1 SPY Nov (18th) 396 call: this is the new MVB buy signal, which was established on the morning of October 4th. This trade’s target is for SPX to trade at the upper, +4σ Band. The stop for this position would be if SPX were to close back below the -4σ Band.
Long 5 HLIT Oct (21st) 12.5 calls: stop yourself out on a close below 12 by HLIT.
Send questions to: [email protected].
Lawrence G. McMillan is president of McMillan Analysis, a registered investment and commodity trading advisor. McMillan may hold positions in securities recommended in this report, both personally and in client accounts. He is an experienced trader and money manager and is the author of the best-selling book, Options as a Strategic Investment. www.optionstrategist.com
Disclaimer: McMillan Analysis Corporation is registered with the SEC as an investment advisor and with the CFTC as a commodity trading advisor. The information in this newsletter has been carefully compiled from sources believed to be reliable, but accuracy and completeness are not guaranteed. The officers or directors of McMillan Analysis Corporation, or accounts managed by such persons may have positions in the securities recommended in the advisory.


