
November kicks off what’s known as the “best six months” of the year, but with midterm elections only a week away, investors are wondering whether stocks can extend a rally following a close-fought battle for control of Congress.
Stock market made a huge comeback in October. The Dow
DJIA,
booked a monthly gain of 14%, its best October performance based on data back to 1896 and its biggest monthly gain since January 1976. The S&P 500
SPX,
and Nasdaq Composite
COMP,
were up 8% and 3.9% for the month, respectively, according to Dow Jones Market Data.
Major indexes remain in a bear market, having fallen sharply this year as the Federal Reserve hiked interest rates at a rapid pace in its effort to wring out still stubborn inflation. The Fed is expected to deliver another 75 basis point rate rise on Wednesday, with investors pining for hints that policy makers will shift to smaller increases in December.
Read: What Fed Chair Powell can say to keep the stock-market rally going — or kill it
After a May-to-October stretch that historically is the worst six-month period for equity investors, November kicks off the “best six months” of the year for stocks, which tells investors that price return for the S&P 500 from November-through-April has recorded the highest average price change of any rolling six-month period, according to the Stock Trader’s Almanac. (See chart below)
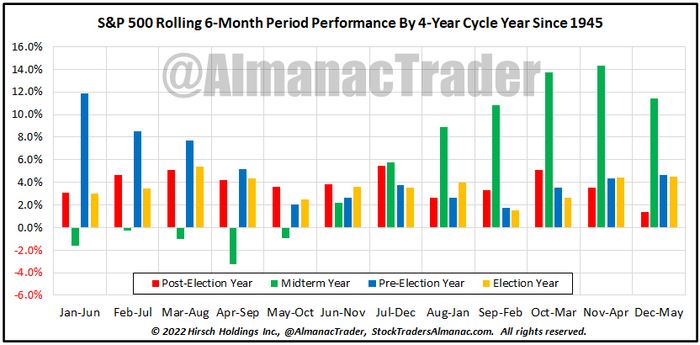
SOURCE: THE STOCK TRADER’S ALMANAC
Read: Republicans have over 70% chance of winning Senate in midterm elections, betting markets say
But 2022 isn’t just another year — it’s a midterm year, with congressional elections fast approaching on Nov. 8. The control of both chambers of Congress is on the line, with all 435 House seats and 35 of the 100 Senate seats up for grabs.
According to data from the Stock Trader’s Almanac, November’s market prowess is “relatively unchanged” in midterm years. Historical data shows the Dow has advanced in 14 of the last 18 midterm years since 1950 with an average gain of 2.5%, while the S&P 500 has been up in 14 of the past 18 midterm years, gaining an average of 2.6%.
Washington Watch: Here’s what the midterm elections could mean for the financial sector, energy, healthcare and more
“The first trading day of November is the fourth best of all monthly first trading days since September 1997, based upon total DJIA points gained,” wrote Jeff Hirsch, editor of the Stock Trader’s Almanac, in a note on Monday. “Three major indexes have all advanced 14 times over the last 21 years. Average performance on the day ranges from a low of 0.2% by S&P 500 to 0.36% by NASDAQ over the 21-year time period.” (See chart below)
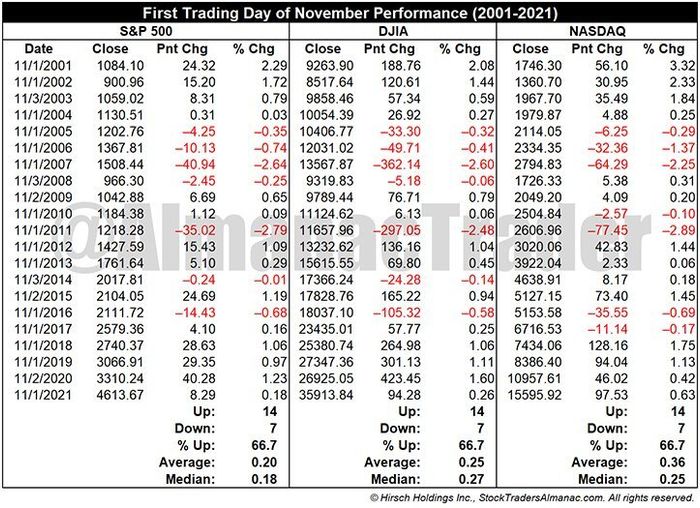
SOURCE: THE STOCK TRADER’S ALMANAC
Which sectors tend to do better?
Sam Stovall, chief investment strategist at CFRA Research, said the cyclical consumer discretionary, industrials, materials, and technology sectors usually do better during the period from November to April, backing up the notion that rather than “sell in May and go away,” as the old market adage advises, it’s better to rotate into sectors that tend to hold up well during the rough calendar stretch.
“The S&P 500 rose an average 6.7%, while the average price gain from equal exposure to these four sectors was 9%,” Stovall wrote in a Monday note. “Conversely, while the overall market was eking out an average six-month advance of 2.4% from May-October, the S&P 500 consumer staples and healthcare sectors recorded average price increases of 4.7%.”
Stovall is convinced that the pattern will still hold true during the midterm election years and the third year of the four-year presidential cycle.
The S&P 500 declined an average 3.4% on a total return basis from April 30 through Oct. 31 of midterm election years since 1992, whereas the CFRA-Stovall Seasonal Rotation Custom Index (SRCI)
SZNE,
rose an average 4.8% and outperformed the market 100% of the time, Stovall said.
Moreover, during the subsequent November-through-April period, which overlaps the end of the midterm election year and the beginning of the third year of the presidential cycle, the results were also favorable, as the S&P 500 gained an average 15.2%, while the SRCI rose an average 17.7% and outpaced the market 88% of the time, according to Stovall.
Skeptics contend that seasonal factors are likely to be overshadowed by gloomy fundamentals.
“We see a bigger problem for stocks than any potential positives from the midterm election outcome: a looming recession. We have argued how central banks rushing to hike policy rates to get inflation back to target would need to crush interest rate-sensitive parts of the economy first,” wrote analysts at BlackRock in an Oct. 31 note.
Need to Know: Stocks usually do well after the midterms. Not this time, forecasts BlackRock
U.S. stock stumbled on Tuesday, the first day of November. The S&P 500 was off 0.4%, while the Dow declined 0.3% and the Nasdaq lost 0.6%.


