
The general state of the stock market seems quite healthy, with the Standard & Poor’s 500 Index making new all-time intraday and closing highs on several recent days.
However, there is some internal deterioration taking place that we didn’t see on similar moves to new all-time highs earlier this year. Potentially, the most worrisome of this group is breadth. More about that in a minute.
Recently, the bears have had several chances to take the market down, but they couldn’t. There were sell signals from a couple of our indicators (but not all of them), and that is sometimes enough to generate at least a market correction. However, this particular market is so strong that it is able to ward off such trivialities.
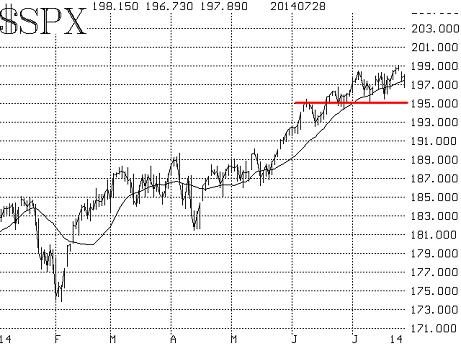
The most important indicator is price, that is, the chart of the S&P 500
SPX,
and that remains strongly positive. All of its major moving averages are rising, and the general area of 1,950 represents very strong support. Each pullback toward that area over the past month has been met with a swift rally. Furthermore, each probe down toward the rising 20-day moving average has also met with support. These trends would have to be broken to change the intermediate-term picture from its current bullish status.
Equity-only put-call ratios remain bearish. That is, they are trending higher and they’ve been in that state for some time. As long as they continue to do so, they will be a bearish indicator for stocks. These sentiment-based ratios are very powerful indicators, and it is not often that they are at odds with market direction, but that is the case right now.
Part of the reason is hedging. Traders are buying puts as protection against a market decline, and that causes the put-call ratios to rise — not because of bearish speculation (which is what we normally want to see in a contrary indicator), but because of hedging. When hedging activity is rampant, a contrary indicator loses its effectiveness, and one must not hold that indicator in much regard until the hedging activity ceases.
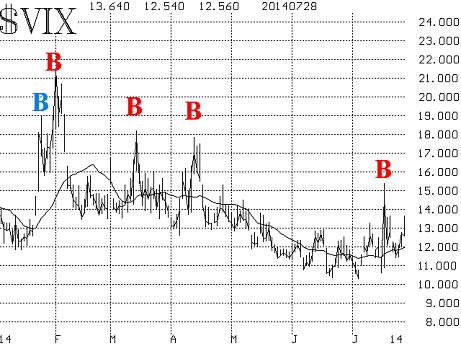
Volatility indexes (VXST)
VIX,
XX:VXV
have been quite interesting of late. For the most part, they have remained at low levels, and that is benign for stocks. In other words, stocks can rally as long as the indexes remain low. However, if they begin to trend higher, that would be a negative for the stock market. Nearly two weeks ago — when there was doubly-bad geopolitical news (Ukraine and Gaza Strip) on the same day — the market sold off sharply and these volatility indexes spiked upward. However, the next day, they spiked right back down again. As a result, not only was there not an uptrend, but in fact, the spiking action in VIX created a buy signal of its own. So, right now that buy signal is still in effect, and as long as the low levels of the volatility indexes continue to persist, stocks can rally.
That now brings us to the fourth indicator — breadth. There are some interesting things going on here. First of all, in the short term, the breadth indicators that we follow are split in their signals — one is bullish, and one is bearish. Breadth has been generally weak, and the breadth indicators can’t seem to reach even mildly overbought status. Typically, when new highs are being made or a new upside leg is beginning, we like to see breadth get overbought. It hasn’t in this most recent case.
But the problems with breadth are deeper than that. Back on July 3, The S&P 500 index traded at a new all-time high, and so did NYSE cumulative breadth. Cumulative breadth is merely the running total of daily advances minus declines. We keep cumulative breadth in two ways — one using NYSE data, and the other using all optionable stocks as our stock universe. Both of those measures showed cumulative breadth at new all-time highs on July 3.
In fact, all of this year, whenever SPX has traded at a new all-time high, so has cumulative breadth (see Figure 3, where each “H” marks both a new all-time high in SPX and a new all-time high in “stocks only” cumulative breadth). But last week, when SPX traded at a new high, cumulative breadth was significantly below its most recent peak (see the right-hand side of Figure 3). This is a negative divergence. Most major market tops are signaled by a decrease in breadth before the top. Sometimes that divergence can last for weeks or even months. Other times, it lasts only a short while. But the key is that once this divergence develops, there are two things to watch:
- If cumulative breadth eventually returns to all-time highs, then all is good, and the upward trend of the market is intact.
- If the divergence persists and SPX breaks its uptrend, then it is time to get aggressively bearish.
So, at the current time, if SPX breaks below 1,950 and this negative breadth divergence is still in place, it would be time to become aggressively bearish — but not before.
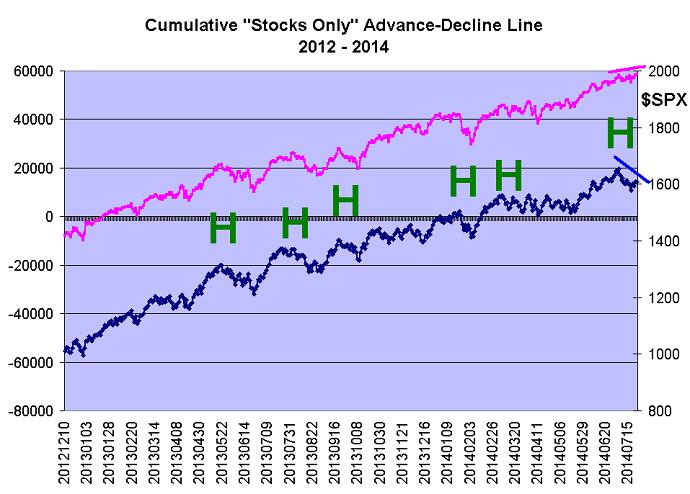
Figure 3. Source: McMillan Analysis Corp.
In summary, the current indicators are somewhat mixed, with volatility and the trend of the market being in the bullish corner, while breadth and put-call ratios are bearish. We wouldn’t turn bearish, though, unless the support at 1,950 were broken on the S&P 500 index.
More from MarketWatch:
3 ‘sell’ strategies to protect retirement savings