The CBOE Volatility Index has captured the attention of market analysts this year as a key relationship between Wall Street’s “fear gauge” and the S&P 500 index appears to have broken down.
Typically, the VIX
VIX,
a popular measure of the stock market’s expectation of volatility based on S&P 500 index options, and S&P 500 index itself
SPX,
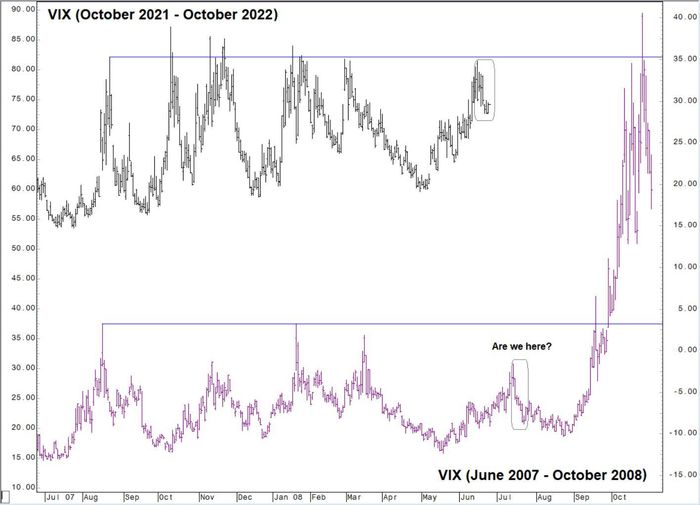
share an inverse correlation. When the S&P 500 falls to new multiyear lows, like it did early this week, the VIX climbs to new highs. However, this relationship has broken down this year. Most recently, the VIX failed to take out its highs from June as the S&P 500 logged its lowest closing low since September 2020 this week.
A similar pattern emerged as stocks fell to what were then their lowest levels of the year in June.
The dynamic can be seen in a chart produced by Katie Stockton, a market strategist at Fairlead Strategies, which can be found below.

FAIRLEAD STRATEGIES
But this trend of lower highs for the VIX isn’t the only technical indicator that has caught market strategists’ attention.
The VIX is on the cusp of achieving a “golden cross” — a term used by market technicians to denote when the 50-day moving average of a given asset, exchange rate or index climbs above the 200-day moving average.
In the past, these “golden crosses” have preceded sharp downturns in stocks. One occurred in September 2008, just before stock-market volatility exploded in response to Lehman Brothers’ bankruptcy, according to Tyler Richey, co-editor of the Sevens Report and a stock-market strategist who closely follows the Vix.
“Using history as a guide, this is the kind of tipping point where things could get ugly,” Richey said.
The previous VIX “golden cross” occurred nearly one year ago in December 2021. The S&P 500, Dow Jones Industrial Average
DJIA,
and Nasdaq Composite
COMP,
reached their cycle peaks little more than one month later.
As of the close of trading on Tuesday, the 50-day moving average for the VIX stood at 25.76, while the 200-day moving average stood at 25.86.
While they’re not as closely followed as the VIX, the CBOE Nasdaq Volatility Index and the CBOE Dow Jones Industrial Average Volatility Index are also on the cusp of reaching the “golden cross” milestone.
Stockton said investors “shouldn’t find any solace” in the latest technical signals emanating from the VIX. However, she told MarketWatch that she doesn’t typically follow the golden cross indicator since the VIX is an “oscillating” gauge not a “trending” one.
As for what might be driving the pattern of lower highs in the VIX, Richey said it could be a result of “real money” investors like mutual funds and pension funds liquidating their holdings, instead of using options-based hedging strategies to protect their downside risk.
As of Wednesday morning, the Vix and other stock-market volatility gauges were mixed as the S&P 500 and the Dow
DJIA,
shook off early losses, while the Nasdaq
COMP,
remained mired in the red.
Looking ahead, Stockton said she believes 35 is the next key “resistance” level for the VIX, which is just below the index’s highs from June.
Should the volatility gauge surmount that level, Stockton said she wouldn’t expect the selling in stocks to stop until the VIX hits 50.
