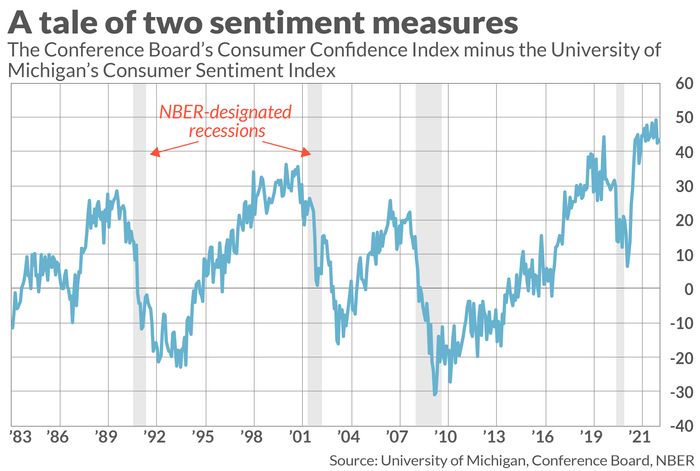
An obscure and arcane economic indicator suggests that Federal Reserve Chairman Jerome Powell was wrong when he said at his Nov. 30 news conference that “There is a path to a soft, a softish landing” for the U.S. economy.
This indicator traces to the large divergence between consumers’ views about the economy in general and their immediate personal financial circumstances in particular. A recession has occurred each time over the past four decades in which this divergence even approached its current level.
To measure this divergence, this indicator focuses on the Conference Board’s Consumer Confidence Index (CCI) and the University of Michigan’s Consumer Sentiment Survey (UMI). While there is some overlap between what these two indices measure, there is a significant difference in emphasis, according to James Stack of InvesTech Research, from whom I first heard about this indicator. The CCI more heavily reflects consumers’ attitudes towards the overall economy, according to Stack, while the UMI is more heavily weighted towards their immediate personal circumstances.
Perhaps not surprisingly, the CCI currently is higher than the UMI. Even as American consumers’ attitudes towards their immediate financial situations continue to sour, due to everything from inflation to higher mortgage rates to a softening housing market, the overall economy has proven to be remarkably resilient. Yet more evidence of this resilience was the Dec. 2 jobs report, in which the Labor Department reported the creation of a much-higher-than-expected number of new jobs.
What is more surprising is the magnitude of the current divergence. According to the latest data releases from the Conference Board and the University of Michigan in late November, the CCI is 43.4 percentage points higher than the UMI. That’s close to a record; the latest reading stands at the 98th percentile of all monthly readings of the past four decades.

Furthermore, as you can see from the chart above, a recession was in the economy’s not-too-distant future (shadowed bars) the past four times this difference rose to even 25 percentage points.
Consumer sentiment and the stock market
Stark as this chart’s correlations are, it’s difficult for a sample with just four observations to be statistically significant. To test this indicator’s potential, I next measured its ability to predict the S&P 500’s
SPX,
inflation-adjusted total return over the subsequent one- and five-year periods. The table below reflects data since 1979, which is when monthly data for both of these consumer indices first began to be reported.
| When divergence between CCI and UMI was… | S&P 500’s average total real return over subsequent 12 months | S&P 500’s average total real return over subsequent 5 years (annualized) |
| In the highest 10% of monthly readings since 1979 | -0.4% | -3.1% |
| In the lowest 10% of monthly readings since 1979 | +14.3% | +14.8% |
The differences shown in this table are statistically significant at the 95% confidence level that statisticians often use when determining if a pattern is genuine.
The bottom line? It’s not good news, for the economy in general or the U.S. stock market in particular, that consumers are so much more upbeat about the overall economy than they are about their immediate financial circumstances.
Mark Hulbert is a regular contributor to MarketWatch. His Hulbert Ratings tracks investment newsletters that pay a flat fee to be audited. He can be reached at [email protected]
Also read: Bigger paychecks are good news for America’s working families. Why does it freak out the Fed?
