Earnings season is almost over. The sector with the best news has been energy, as fossil-fuel companies benefit from sky-high oil and gas prices.
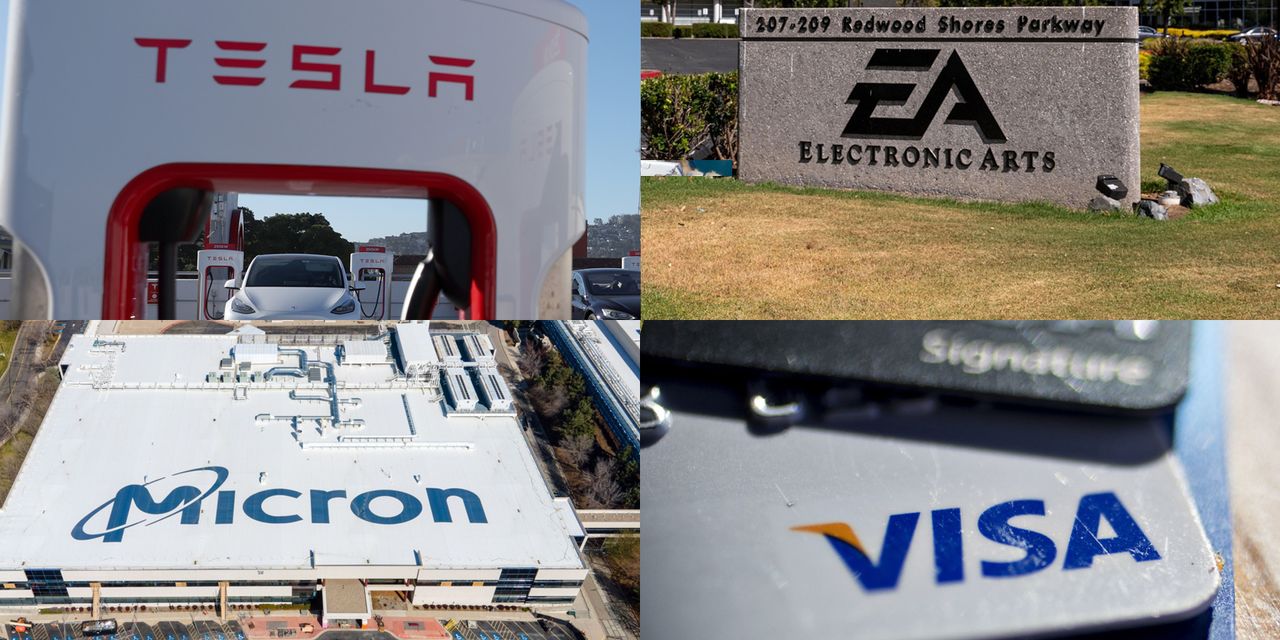
But what about technology, which had been in a rut until the sector rebounded in June? A list of standouts in the S&P 500, including chip and financial-technology companies, is below.
In a note to clients on Aug. 7, Wedbush analyst Daniel Ives called the second quarter “a major victory for the tech bulls as enterprise spending, cloud-driven budgets, consumer product/e-commerce demand, and even digital advertising was ‘much better than feared’ given the white knuckle backdrop.”
There are many moving parts in this new environment as the economy continues to move past the coronavirus epidemic, during which business conditions were changed by government stimulus, the work-from-home trend and other factors.
Now, the tech world must contend with rising input costs in a high-inflation environment with a tight labor supply, a very strong dollar (which hurts exports for U.S. companies) and lingering shortages.
There are some difficult comparisons to prior-period sales. For example, Nvidia Corp.
NVDA,
which is scheduled to announce its full results for the fiscal quarter ended July 31 on Aug. 24, issued a warning on Aug. 8 that sent its stock down 6%, for a year-to-date decline of 40%. The company said it expected sales for the quarter to come in at $6.7 billion, down from its previous estimate of $8.1 billion. That $6.7 billion figure would be only a 3% increase in quarterly sales from a year earlier.
Nvidia, an investor darling with a 318% share-price increase over the past five years, blamed the disappointing results, in part, on “macroeconomic headwinds” and “challenging market conditions.”
In this dynamic environment, it might be useful for investors to know which companies have been able to improve quarterly sales the most, while also improving gross margins and operating margins. (A company’s gross margin is a useful measurement of pricing power.)
Screen of outstanding technology companies
A quick word about earnings season: It isn’t so strictly defined, because more than a quarter of the S&P 500
SPX
have fiscal years that don’t match the calendar. Nvidia’s second quarter of fiscal 2023 ended July 31, for example.
But among the S&P 500, 87% of companies had reported results for fiscal quarters ended May 15 or later through Aug. 8, according to FactSet.
The next challenge is to identify which companies should be considered technology players, because the S&P 500’s tech sector excludes companies such as Alphabet Inc.
GOOG
GOOGL,
Meta Platforms Inc.
META,
Twitter Inc.
TWTR
and three video-game developers, which are in the communications services sector, and Amazon.com Inc.
AMZN
and Tesla Inc.
TSLA,
which are in the consumer discretionary sector.
Adding the companies above to the 76 companies in the S&P 500 information technology sector gives us a list of 84 companies, 67 of which had announced results for fiscal quarters ended May 15 or later, through Aug. 8.
Among the group of 67, only 18 companies managed to improve gross and operating margins according to the data available from FactSet.
Here’s the entire list, ranked by increases in quarterly sales:
| Company | Ticker | Increase in sales from year-earlier quarter | Gross margin | Gross margin – year-earlier quarter | Operating margin | Operating margin – year-earlier quarter | Price change – 2022 through Aug. 8 |
| Monolithic Power Systems Inc. |
MPWR |
57% | 58.78% | 55.99% | 33.13% | 23.64% | 9% |
| Tesla Inc. |
TSLA |
42% | 25.00% | 24.12% | 20.83% | 16.86% | -18% |
| KLA Corp. |
KLAC |
29% | 61.65% | 59.25% | 45.82% | 41.79% | -10% |
| NXP Semiconductors NV |
NXPI |
28% | 52.69% | 49.42% | 37.86% | 33.86% | -21% |
| Microchip Technology Inc. |
MCHP |
25% | 58.17% | 50.47% | 48.06% | 41.51% | -19% |
| ON Semiconductor Corp. |
ON |
25% | 48.69% | 36.85% | 40.08% | 27.12% | -1% |
| Ceridian HCM Holding Inc. |
CDAY |
20% | 51.06% | 45.97% | 8.33% | 3.79% | -37% |
| CDW Corp. |
CDW |
19% | 19.01% | 17.15% | 8.24% | 8.09% | -13% |
| Visa Inc. Class A |
V |
19% | 76.76% | 75.73% | 70.23% | 69.71% | -2% |
| Micron Technology Inc. |
MU |
16% | 46.69% | 41.85% | 55.76% | 50.70% | -34% |
| Texas Instruments Inc. |
TXN |
14% | 69.55% | 67.18% | 58.12% | 54.76% | -3% |
| Electronic Arts Inc. |
EA |
13% | 81.72% | 77.39% | 35.31% | 27.90% | -1% |
| Automatic Data Processing Inc. |
ADP |
10% | 46.72% | 45.49% | 23.21% | 21.86% | 1% |
| Fiserv Inc. |
FISV |
10% | 54.07% | 51.39% | 37.51% | 36.07% | 1% |
| VeriSign Inc. |
VRSN |
7% | 85.93% | 85.49% | 70.45% | 68.30% | -22% |
| Global Payments Inc. |
GPN |
7% | 57.81% | 56.19% | 42.60% | 41.37% | -4% |
| ANSYS Inc. |
ANSS |
6% | 85.96% | 84.64% | 34.86% | 33.71% | -30% |
| Citrix Systems Inc. |
CTXS |
6% | 77.04% | 75.42% | 31.10% | 21.32% | 8% |
| Source: FactSet | |||||||
Click on the tickers for more about each company.
Click here for Tomi Kilgore’s detailed guide to the wealth of information for free on the MarketWatch quote page.
Don’t miss: 15 quality dividend stocks that you can buy on sale right now
