A new bear-market low is likely still in the cards for U.S. stocks, for two contrarian-related reasons:
First, at no point in the current bear market has there been the deep pessimism and despair that frequently accompanies major bottoms — what many refer to as capitulation, or throwing in the towel.
Second, whenever even moderate pessimism has emerged, it has been short-lived; investors instead have been eager to jump on the bullish bandwagon at the mere whiff of a possible rally.
Let me focus first on capitulation. In previous columns I have discussed three distinct definitions of capitulation, and none have been triggered despite the market’s weakness:
- The first definition is the percentage of trading days over the trailing month in which both of my firm’s stock-market sentiment indices are in the bottom deciles of their historical distributions. On June 17, the day of what so far has been the bear market’s low, this metric stood at 33.3%, which was nowhere close to levels seen at past bear market bottoms — which sometimes have exceeded 80%. It currently stands at just 14.2%.
-
Another definition of capitulation I have mentioned in prior columns comes from TheDowTheory.com, an advisory service founded by Jack Schannep. The service’s criteria for capitulation are proprietary and change weekly. In an email, editor Manuel Blay said that for this week, capitulation would require at least two of the following three market averages to close below their respective levels: The Dow Jones Industrial Average
DJIA,
+0.64%
below 28,225.60; S&P 500
SPX,
+0.69%
below 3,548.50, and the NYSE Composite
NYA,
+0.69%
below 13,259.53. Notice that each of these levels is below the June lows. - A third definition of capitulation I have mentioned in prior columns comes from Sam Stovall, chief investment strategist at CFRA Research. His definition is based on the “15-day average of daily percent differences between intra-day highs and lows for the S&P 500,” and capitulation occurs “when spikes [are] well above two standard deviations.” Not only was this threshold not breached at the June low, it currently stands at 1.32, also well-short.
Eagerness up and down Wall Street
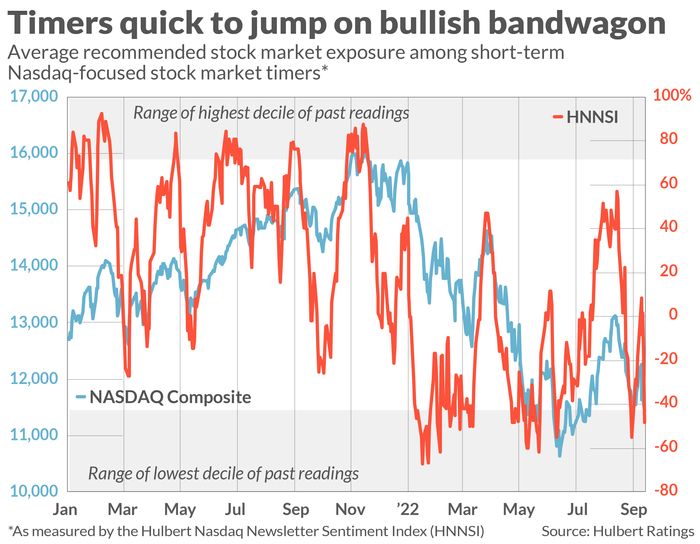
To illustrate the eagerness with which market timers turn bullish in the wake of a rally, look at the chart below. It plots the Hulbert Nasdaq Newsletter Sentiment Index (HNNSI), which reflects the average recommended equity exposure level among a subset of short-term market timers who focus on the Nasdaq market in particular. Notice that this average so far this year has only briefly dipped into the bottom decile of its distribution, sometimes for just one trading session.

Furthermore, as the chart shows, there were two occasions over the past five months in which the HNNSI spiked upwards to within shouting distance of the highest decile of its distribution — indicating excessive bullishness. This is evidence of the “slope of hope” that, according to contrarians, is typical of bear markets. It’s not the sentiment you’d expect if the final low of this bear market was close.
Mark Hulbert is a regular contributor to MarketWatch. His Hulbert Ratings tracks investment newsletters that pay a flat fee to be audited. He can be reached at [email protected]
Also read: The tightening squeeze on corporate profits is the biggest risk to the stock market right now
Plus: Fearing a hawkish Fed? Here’s what’s likely limiting more downside in the stock market,
