The stock market had two strong rally days this week.
That was mostly because of the massive oversold condition that existed, and it was aided by news from Europe that central banks were easing off on the increase in interest rates. There is some hope that could be the case in the U.S. as well, although the Federal Reserve has given no signs of that being the case.
The S&P 500
SPX,
had made new intraday and closing lows at the end of September. The subsequent huge rally coincided with a change of the calendar to October. I doubt if there is any real connection between the rally and the month of October, although October is known as the “bear killer” month.
Yes, there have been some massive declines in October, but by month’s end, the market has usually bottomed and is headed higher. In some cases, major bear markets have ended in October (1974, 1987 and 2002, for example — although in all three cases there was a retest of the lows in December). In the current bear market, perhaps October 2023 would be a better target month for the low.
Regardless, some oversold conditions have rolled over to confirmed buy signals, and that is aiding the rally so far. There is support at the recent lows, near 3600 points. Overhead, there is resistance near 3900.
The two island reversals (pink circles on the accompanying SPX chart) and the blue trend lines are more substantial bearish items. An oversold rally usually reaches and slightly exceeds the declining 20-day moving average (MA), which currently is at about 3820. So a move toward 3900 would not be out of the question.
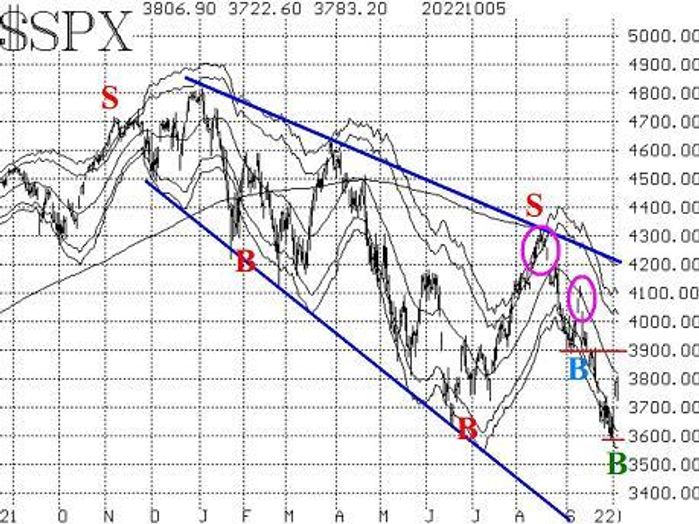
The previous McMillan Volatility Band (MVB) buy signal of early September was stopped out when SPX closed below the -4σ “modified Bollinger Band” in the last week of September. That was the first losing MVB trade in a while (denoted by a blue “B” on the SPX chart; red letters denote successful signals). A new MVB buy signal has now taken place, though, as of Oct. 3 (green “B” on the SPX chart). This new buy signal has as its target the +4σ Band, which is currently at about 4080 and moving sideways. It would be stopped out of SPX fell back below the -4σ Band once again.
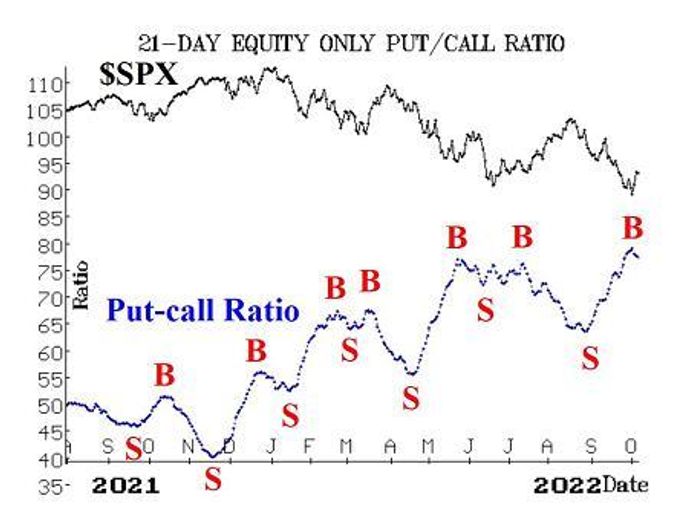
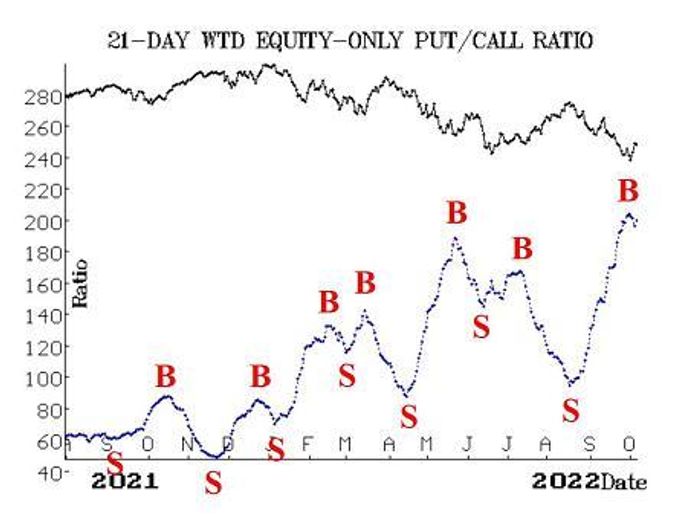
Equity-only put-call ratios have finally rolled over and begun to decline. That is the definition of a buy signal, and these signals are coming from extremely oversold conditions (i.e., from very high on their charts). These new buy signals are confirmed by the computer programs that we use to analyze these charts. A move to new highs would stop out these new buy signals. Otherwise, they will remain in place as long as the ratios continue to decline. The total put-call ratio is also working on a new buy signal, but that one has not yet been confirmed.
Breadth has been swinging wildly back and forth. It was terrible at the end of September when SPX was making new year-to-date lows. It has improved greatly on the October rally (in fact, Oct. 4 was a 90% “up” day), but the bottom line is that the breadth oscillators are still on sell signals. They were so oversold and so negative that they have not been able to rise out of that state even with some recent strong days of positive breadth.
The number of new highs on the NYSE has not increased much, so this indicator (new highs vs. new lows) remains mired on the sell signal that has been in place since April.
The CBOE Volatility Index
VIX,
continues to have dampened reactions in both directions. When SPX was making new year-to-date lows in late September, VIX did rise back to 35, but that is still a muted reaction to what was a very nasty market decline. Since then, as SPX has rallied, VIX has declined as one might expect. But the decline in VIX has been modest as well, as VIX remains well above its 200-day MA (and hence the trend of VIX sell signal remains in place).
Countering that intermediate-term trend sell signal is the fact that a new VIX “spike peak” buy signal was generated on Sept. 28 and remains in place. While both signals have stops (see the Follow-Up section for specifics), neither stop is imminent.
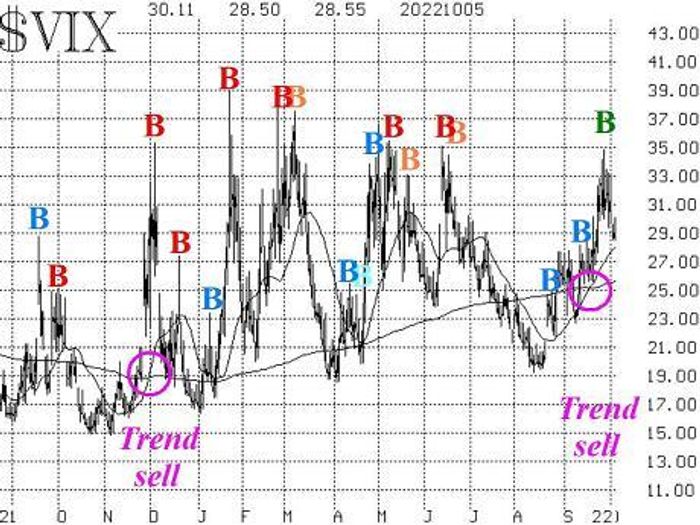
The construct of volatility derivatives has improved somewhat as far as its outlook for stocks goes, but it is still in a somewhat tenuous state. That is because the front-month October VIX futures continue to trade at a slightly higher price than November VIX futures at times, and the first three months have not resumed an upward slope. The same has been true of the CBOE Volatility Indices term structure, as the near-term indices have risen sharply at times.
In summary, we are maintaining our “core” bearish position because of the negative trend of SPX and the positive trend of VIX. However, we are trading oversold buy signals around that “core” position.
New recommendation: Harmonic
Harmonic Inc.
HLIT,
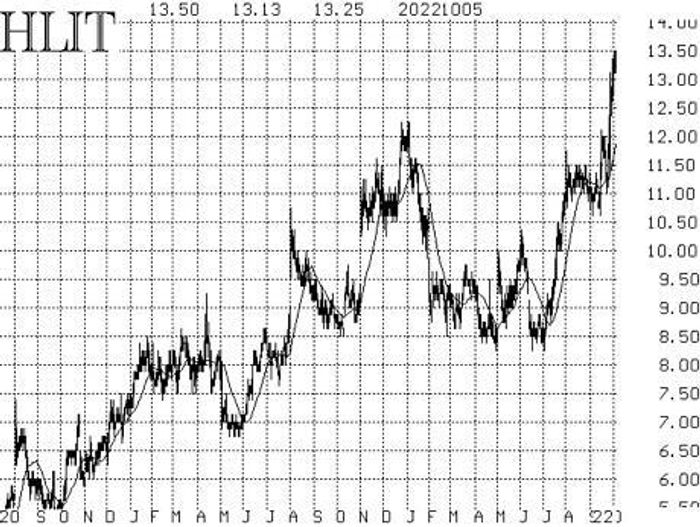
has been a strong stock recently, making new yearly highs even as the broad market has struggled. There does not seem to be a specific reason for the stock’s rise, other than a strong technical picture.
Buy 5 HLIT Oct (21st) 12.5 calls
At a price of 1.10 or less.
HLIT: 13.32 Oct (21st) 12.5 calls: offered at 1.45
If the calls are bought, stop yourself out on a close below 12 by the underlying stock.
New recommendation: Bristol-Myers Squibb
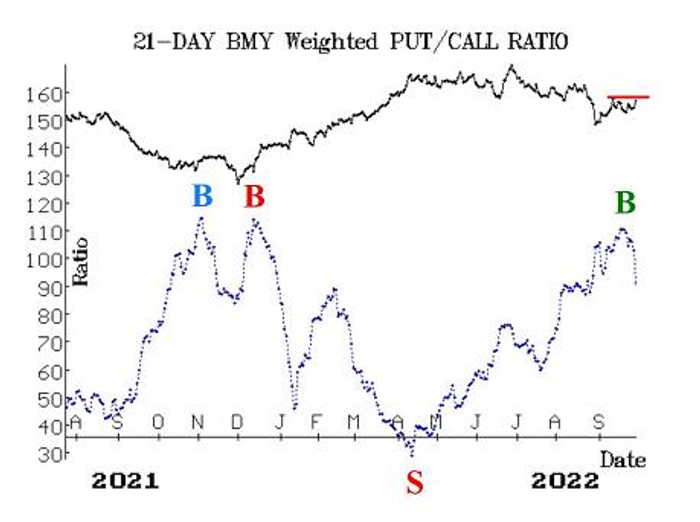
We are repeating this recommendation from last week, since the condition for entry was not met (yet). The weighted put-call ratio in Bristol-Myers Squibb Co.
BMY,
is giving a buy signal from a deeply oversold level. The last time that happened was in December of 2021, and that launched a strong rally in the stock.
IF BMY closes above 72.50,
THEN Buy 3 BMY Dec (16th) 72.5 calls
BMY: 72.06
If bought, these call will be held as long as the put-call ratio buy signal is in effect.
Follow-up action
All stops are mental closing stops unless otherwise noted.
We are using a “standard” rolling procedure for our SPY spreads: In any vertical bull or bear spread, if the underlying hits the short strike, then roll the entire spread. That would be roll up in the case of a call bull spread, or roll down in the case of a bear put spread. Stay in the same expiration, and keep the distance between the strikes the same unless otherwise instructed.
Long 1 SPY Oct (21st) 377 put and Short 1 SPY Oct (21st) 347 put: This is our “core” bearish position. Previously, it was twice rolled down 30 points on each strike (per our general rule of “rolling” stated above). There is no longer a stop for this position at this time.
Long 6 CANO Oct (21st) 7 calls: Option volume in CANO has elevated again, riding the momentum of rumors related to possible takeover interest by CVS, HUM and others. A Citi analyst recently estimated a possible takeover price as high as $14 for CANO. The stop remains at 7.25.
Long 2 BFB Oct (21st) 75 puts: We will hold these puts as long as the BFB put-call ratio is on a sell signal. If BFB trades at 65, THEN roll down to the Oct (21st) 65 puts.
Long 1 SPY Oct (28th) 406 call and Short 1 SPY Oct (28th) 421 call: This spread was bought in line with the McMillan Volatility Band (MVB) buy signal of Sept. 9. It was not stopped out, but we are going to exit now because of the number of newer buy signals involving options with lower strikes. Sell this spread now.
Long 0 HOLI Oct (21st) 20 calls: These calls were stopped out when HOLI closed below 17.60 on Sept. 30.
Long 1 SPY Oct (28th) 391 and Long 1 SPY Oct (28th) 366 put: This started out as the long 391 straddle; then we rolled the Oct (28th) 391 put down to the Oct (28th) 366 put. Continue to hold without a stop for now.
Long 1 SPY Oct (28th) 377 put and Short 1 SPY Oct (28th) 352 put: This spread was bought in line with the trend of VIX sell signal. stop yourself out if VIX closes below 25 for two consecutive days.
Long 1 SPY Oct (28th) 372 call and Short 1 SPY Oct (28th) 387 call: This spread was bought in line with the $VIX “spike peak” buy signal, which was finally confirmed at the close of trading on Sept. 27. Stop yourself out if VIX returns to “spiking mode” – that is, if it closes at least 3.00 points higher over any 1-, 2-, or 3-day period (using closing prices).
Long 1 SPY Nov (18th) 376 call and Short 1 SPY Nov (18th) 396 call: This is the new MVB buy signal, which was established on the morning of Oct. 4. This trade’s target is for SPX to trade at the upper, +4σ Band. The stop for this position would be if SPX were to close back below the -4σ Band.
Send questions to: [email protected].
Lawrence G. McMillan is president of McMillan Analysis, a registered investment and commodity trading advisor. McMillan may hold positions in securities recommended in this report, both personally and in client accounts. He is an experienced trader and money manager and is the author of the best-selling book, Options as a Strategic Investment. www.optionstrategist.com
Disclaimer: ©McMillan Analysis Corporation is registered with the SEC as an investment advisor and with the CFTC as a commodity trading advisor. The information in this newsletter has been carefully compiled from sources believed to be reliable, but accuracy and completeness are not guaranteed. The officers or directors of McMillan Analysis Corporation, or accounts managed by such persons may have positions in the securities recommended in the advisory.
