The stock market is attempting to put together a rally after making new lows a week ago.
Oversold rallies, as they’re sometimes called, typically reach the declining 20-day moving average (MA). The current oversold rally has already accomplished that, since the 20-day MA of the S&P 500
SPX,
is at roughly 3670 points.
This rally has also managed to close the first (lowest) gap on the SPX chart, below, by trading up to 3760. But now the rally appears to have stalled.
There is resistance in the 3750-3800 area, and it would take a close above 3800 to upgrade this from an “oversold rally” to a “bear market rally.” That’s right: This is still a bear market, despite the distance this rally might cover.
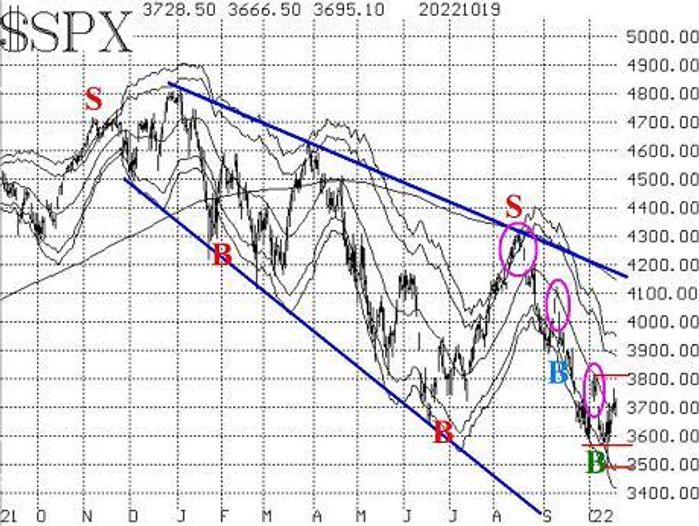
The McMillan Volatility Band (MVB) buy signal remains in place, and its target is the upper +4σ “modified Bollinger Band,” which is at about 3960. That signal would be stopped out if SPX closed below the -4σ Band, currently near 3400 and falling.
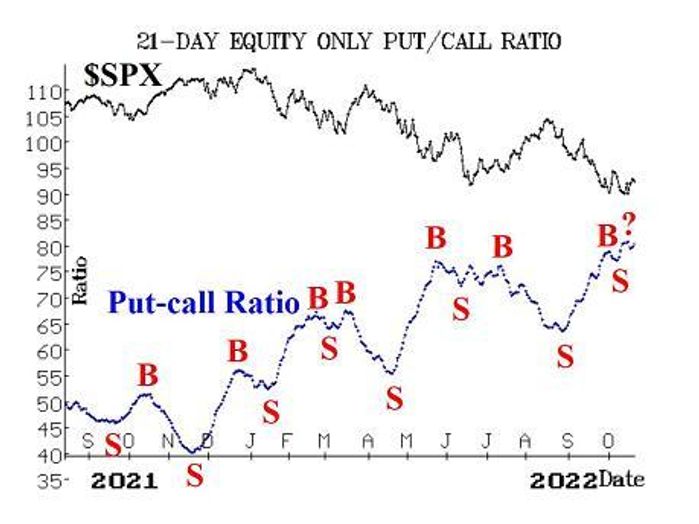
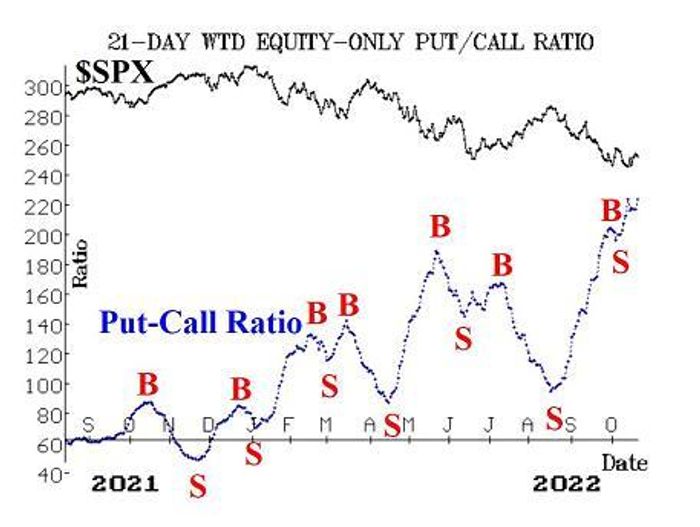
Equity-only put-call ratios are at extremely high levels and appeared to be attempting to generate buy signals a few days ago. But that has not occurred. The weighted ratio made a new 2022 high yesterday, and thus remains on a sell signal. The standard ratio is not far behind. We also follow the total put-call ratio, and it is a little more positive in that it has generated a buy signal and has not traded back above its recent highs. The total put-call buy signal occurred on the day that SPX closed at 3719. These total P-C ratio buy signals are normally worth at least 100 points on the SPX, meaning that if this one follows the norm, SPX will break out over 3800. We shall see.
Breadth has been swinging wildly back and forth. Breadth oscillators had been deeply oversold but recovered enough to generate what appeared to be buy signals. However, we have seen a number of occurrences where a new signal was quickly reversed, so we are waiting for a two-day confirmation of any new buy signal. That did not occur, since breadth was poor on Oct. 19 and drove the oscillators back down into sell signals.
New 52-week highs on the NYSE remain small in number. Thus, the indicator that compares new highs vs. new lows remains on a sell signal, as it has since last April.
VIX
VIX,
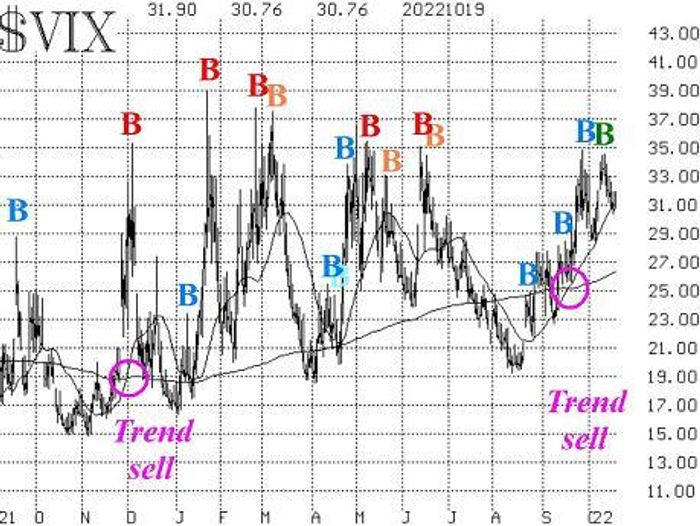
has slowly declined, as the market has attempted to rally this week. In the short term, this is positive because a new VIX “spike peak” buy signal has been generated (marked by a green “B” on the VIX chart), and we have bought a new SPY call bull spread in line with that signal. However, the trend of VIX sell signal — a more intermediate-term indicator — remains in place, and VIX would have to close below its rising 200-day moving average (currently near 26) in order to terminate that sell signal.
The construct of volatility derivatives remains in a modestly negative state for stocks. November VIX futures are the new front month, so we are monitoring their price vis-à-vis that of the December VIX futures. Currently, November is trading slightly above December, which is a modestly negative indicator for stocks. There was a “VIX crossover” buy signal as of last Friday (Oct. 14). Those are short-term signals that produce their best results in the first five trading days, so it will “expire” at the end of this week.
In summary, we are maintaining our “core” bearish position because of the trends of SPX (down) and VIX (up). We will, however, trade other confirmed signals around that “core” position.
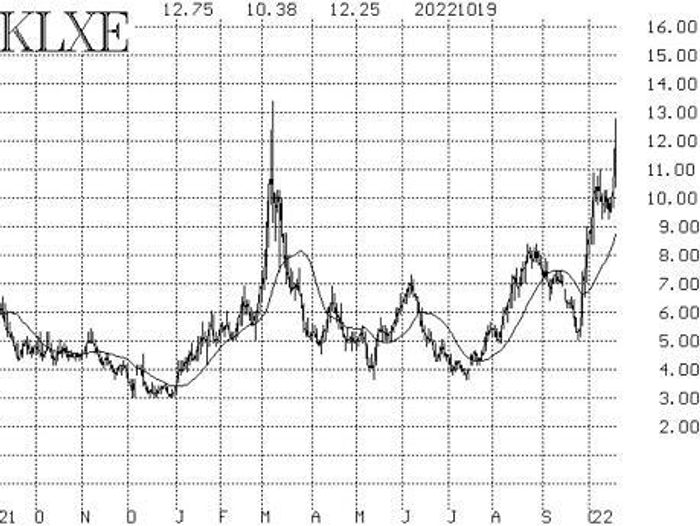
New recommendation: KLX Energy
KLX Energy
KLXE,
has broken out to the upside. There is no takeover rumor that I am aware of, but the chart pattern is very strong. The options are quite expensive, though, so we are going to recommend the stock.
Buy 300 KLXE
In line with the market.
KLXE: 11.92
Stop yourself out on a close below 9.20.
Note: aggressive options traders might consider what is currently called a “split strike reversal”: buy the Nov 12.5 call and sell the Nov 10 put for a debit of 1.00 or so. We are not recommending that officially in this report, however.
New recommendation: WestRock
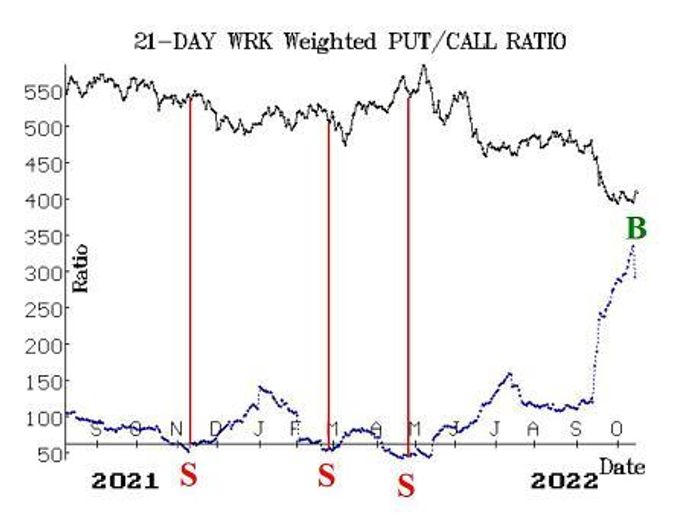
There is a new weighted put-call ratio buy signal in WestRock
WRK,
emanating from an extremely oversold level.
Buy 2 WRK Jan (20th) 32.5 calls
At a price of 3.20 or less.
WRK: 32.60 Jan (20th) 32.5 calls: 2.50 bid, offered at 3.80
We will hold as long as the weighted put-call ratio remains on a buy signal.
Follow-up action:
All stops are mental closing stops unless otherwise noted.
We are using a “standard” rolling procedure for our SPY
SPY,
spreads: in any vertical bull or bear spread, if the underlying hits the short strike, then roll the entire spread. That would be roll up in the case of a call bull spread, or roll down in the case of a bear put spread. Stay in the same expiration, and keep the distance between the strikes the same unless otherwise instructed.
Long 1 SPY Nov (18th) 352 put and Short 1 SPY Nov (18th) 325 put: this is our “core” bearish position. Previously, it was rolled down three times. Continue to hold without a stop.
Long 6 expiring CANO Oct (21st) 7 calls: CVS
CVS,
walked away from a potential deal with CANO
CANO,
Do not replace the expiring calls.
Long 2 expiring BFB
BF.B,
Oct (21st) 65 puts: attempt to roll to the Nov (18th) 65 puts for a debit of 2.00 points or less. If that limit cannot be met, then late on Friday (October 21st), well your Oct 65 puts, thus closing the position. The put-call ratio is still rising, but it is in extremely oversold territory.
Long 1 SPY Oct (28th) 391 and Long 1 SPY Oct (28th) 366 put: this started out as the long 391 straddle; then we rolled the Oct (28th) 391 put down to the Oct (28th) 366 put. Continue to hold without a stop for now. Roll the put down again if SPY trades at 346.
Long 1 SPY Oct (28th) 352 put and Short 1 SPY Oct (28th) 327 put: this spread was bought in line with the trend of VIX sell signal and was rolled down last week. stop yourself out if VIX closes below 25 for two consecutive days.
Long 1 SPY Nov (18th) 376 call and Short 1 SPY Nov (18th) 396 call: this is the new MVB buy signal, which was established on the morning of October 4th. This trade’s target is for SPX to trade at the upper, +4σ Band. The stop for this position would be if SPX were to close back below the -4σ Band.
Long 5 expiring HLIT
HLIT,
Oct (21st) 12.5 calls: roll out to the Nov (18th) 12.5 calls. Raise the trailing stop to 13.40.
Long 1 SPY Nov (18th) 358 call and Short 1 SPY Nov (18th) 378 call: the bull spread was bought in line with the VIX crossover buy signal, which was confirmed at the close of October 14th. Stop yourself out if VIX closes back above VIX3M for two consecutive days. Otherwise, exit the position at the close of trading on Friday, October 21st.
Long 1 SPY Nov (18th) 367 call and Short 1 SPY Nov (18th) 387 call: this spread was bought in line with the latest VIX “spike peak” buy signal, which was confirmed on Monday, October 17th. Stop yourself out if VIX closes above 34.53. Otherwise, we will hold for 22 trading days (about a month).
Send questions to: [email protected].
Lawrence G. McMillan is president of McMillan Analysis, a registered investment and commodity trading advisor. McMillan may hold positions in securities recommended in this report, both personally and in client accounts. He is an experienced trader and money manager and is the author of the best-selling book, Options as a Strategic Investment. www.optionstrategist.com
Disclaimer: ©McMillan Analysis Corporation is registered with the SEC as an investment advisor and with the CFTC as a commodity trading advisor. The information in this newsletter has been carefully compiled from sources believed to be reliable, but accuracy and completeness are not guaranteed. The officers or directors of McMillan Analysis Corporation, or accounts managed by such persons may have positions in the securities recommended in the advisory.
