The benchmark S&P 500 Index has finally fallen below the 3900- to 4100-point trading range.
The move prompted an immediate reaction down to 3800, the next support level. (To see my suggestion for a so-called Santa Claus rally, please see the next item, below.)
Frankly, I would have expected more selling after the S&P 500
SPX,
broke a support level of that magnitude (perhaps a move to 3700).
So, 3700 is the next support level, and then there is support at the yearly lows near 3500. On the upside, there is now resistance in the 3900-3940 area.

The larger picture is that SPX is still in a downtrend, and that the last rally failed in early December right at the downtrend line that defines this bear market. The declining 200-day moving average (MA) was also in that same area, near 4100.
We are closing our positions in the McMillan Volatility Band (MVB) buy signal that occurred in early October, and we will now wait for a new signal to set up. If SPX were to close below the lower -4σ Band (currently at 3760 and declining), that would be the first step toward a new buy signal. That does not appear to be imminent.
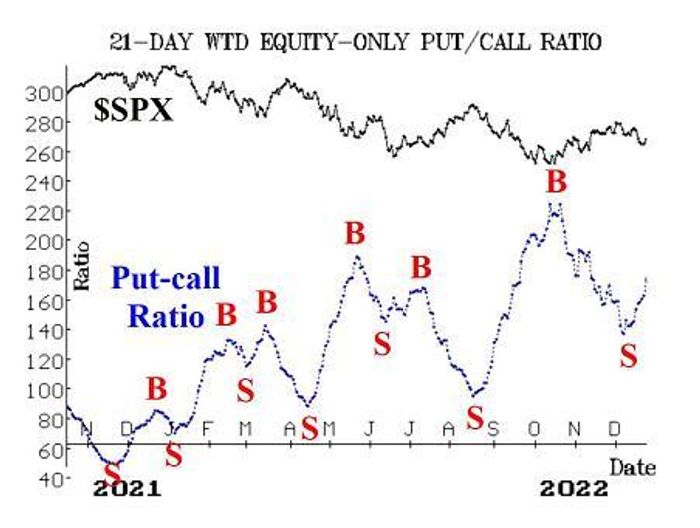
Equity-only put-call ratios continue to rise and, thus, remain on sell signals. There has been some relatively heavy put buying in stock options over the past few weeks, and that has been a major contributing factor in the rise in the put-call ratios. These ratios are rather high on their charts, so they are considered to be in oversold territory. However, “oversold” does not mean “buy.”


After the market broke below 3900, breadth was poor for the next two days. That pushed the breadth oscillators — which were already on sell signals dating back to December 5th — into oversold territory. We are now watching to see if they can generate buy signals. In fact, the NYSE breadth oscillator did generate a buy signal as of December 21st, but the “stocks only” oscillator has not. We generally require that any signal from this indicator (which is subject to whipsaws) persist for at least two consecutive days before considering it to be an actionable signal.
New 52-week highs on the New York Stock Exchange have lagged for some time again, and thus the “new highs vs. new lows” indicator remains on a sell signal.
So, the above indicators are relatively negative, but that is contrasted by the CBOE Volatility Index
VIX,
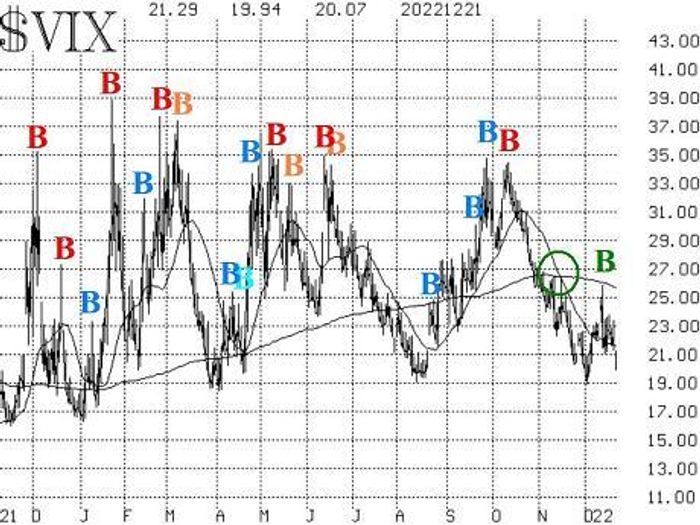
indicators, which are more bullish. The VIX “spike peak” buy signal of December 13th remains in place. Moreover, the trend of VIX buy signal, which is a more intermediate-term signal, remains in place. VIX would have to rise above 26 to cancel out these buy signals.

The construct of volatility derivatives remains bullish. That is, the term structures of the VIX futures and of the CBOE Volatility Indices slope upward. Moreover, the VIX futures are all trading at a premium to VIX. January VIX futures are now the front month, so we are watching for a warning sign, which would come if Jan VIX futures rose above the price of Feb VIX futures. That is not in danger of happening at this time.
The seasonal patterns that supposedly “rule” between Thanskgiving and the beginning of the new trading year have not worked out this year. The last of those patterns is yet to come, though — the Santa Claus rally — and it may still be able to salvage something for the bulls.
In summary, we continue to maintain a “core” bearish position and will continue to do so as long as SPX is in a downtrend. We will trade confirmed signals from our other indicators around that “core” position.
New recommendation: Santa Claus rally
The Santa Claus rally is a term and market seasonal pattern defined by Yale Hirsch over 60 years ago. It has a strong track record. The system is simple: The market rises over the last five trading days of one year and the first two trading days of the next year — a seven-day period.
This year the system begins at the close of trading on Thursday, December 22nd (today). However, if that period does not produce a gain by SPX, that would be a further negative for stocks going forward.
At the close of trading on Thursday, December 22nd,
Buy 2 SPY Jan (13th) at-the-money calls
And Sell 2 SPY Jan (13th) calls that are 15 points out of the money.
There is no stop for this trade, except for time. If the SPDR S&P 500 ETF Trust
SPY,
trades at the higher strike while the position is in place, then roll the entire spread up 15 points on each side. In any case, exit your spreads at the close of trading on Wednesday, January 4th (the second trading day of the new year).
Follow-up action
All stops are mental closing stops unless otherwise noted.
We are using a “standard” rolling procedure for our SPY spreads: in any vertical bull or bear spread, if the underlying hits the short strike, then roll the entire spread. That would be roll up in the case of a call bull spread, or roll down in the case of a bear put spread. Stay in the same expiration, and keep the distance between the strikes the same unless otherwise recommended.
Long 2 SPY Jan (20th) 375 puts and Short 2 Jan (20th) 355 puts: this is our “core” bearish position. As long as SPX remains in a downtrend, we want to maintain a position here.
Long 1 SPY Jan (6th) 408 call and short 1 SPY Jan (6th) 423 call: this trade is based on the MVB buy signal, which was established on October 4th. We have already rolled up a couple of times and taken some profit out of the position. Close the remaining spread now.
Long 2 KMB Jan (20th) 135 calls: we rolled this position up last week. The closing stop remains at 135.
Long 2 IWM Jan (20th) 185 at-the-money calls and Short 2 IWM Jan (20th) 205 calls: this is our position based on the bullish seasonality between Thanksgiving and the second trading day of the new year. We will adjust this position if IWM rallies during the holding period, but initially there is no stop for the position, so the entire debit is at risk.
Long 2 PSX Jan (20th) 105 puts: we intended to hold these puts as long as the weighted put-call ratio remains on a sell signal. However, the put-call ratio has rolled over to a buy signal, so exit these puts now.
Long 2 AJRD Jan (20th) 52.5 calls: AJRD received an all-cash takeover offer of $56, so exit these calls now. Do not sell them below parity.
Long 1 SPY Jan (20th) 402 call and Short 1 SPY Jan (20th) 417 calls: this spread was bought at the close on December 13th, when the latest VIX “spike peak” buy signal was generated. Stop yourself out if VIX subsequently closes above 25.84. Otherwise, we will hold for 22 trading days.
Long 1 SPY Jan (20th) 389 put and Short 1 SPY Jan (20th) 364 put: this was an addition to our “core” bearish position, established when SPX closed below 3900 on December 15th. Stop yourself out of this spread if SPX closes above 3940.
Long 2 PCAR Feb (17th) 97.20 puts: these puts were bought on December 20th, when they finally traded at our buy limit. We will continue to hold these puts as long as the weighted put-call ratio is on a sell signal.
Send questions to: [email protected].
Lawrence G. McMillan is president of McMillan Analysis, a registered investment and commodity trading advisor. McMillan may hold positions in securities recommended in this report, both personally and in client accounts. He is an experienced trader and money manager and is the author of the best-selling book, Options as a Strategic Investment. www.optionstrategist.com
Disclaimer: ©McMillan Analysis Corporation is registered with the SEC as an investment advisor and with the CFTC as a commodity trading advisor. The information in this newsletter has been carefully compiled from sources believed to be reliable, but accuracy and completeness are not guaranteed. The officers or directors of McMillan Analysis Corporation, or accounts managed by such persons may have positions in the securities recommended in the advisory.
