How good is a company’s chief executive officer at investing your money most efficiently? This is an important question for long-term investors. It may underline the difference between a steady long-term performer and a flash in the pan.
And Apple Inc.
AAPL,
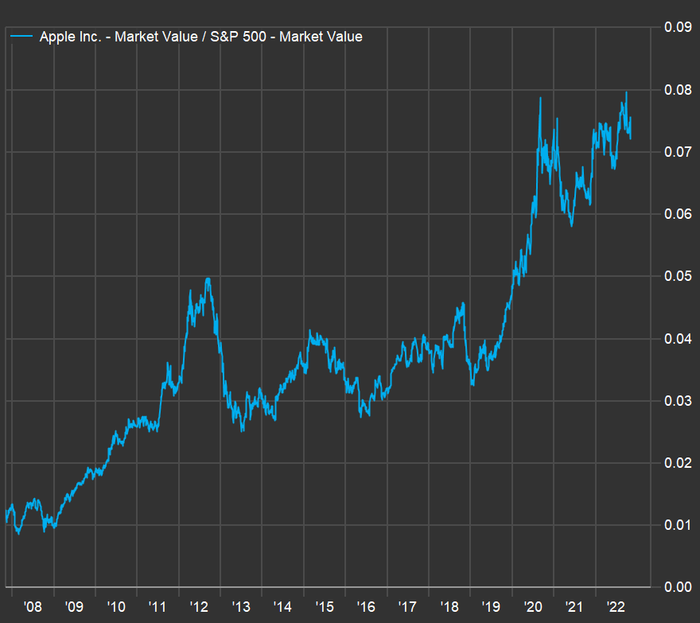
now makes up 7% of the SPDR S&P 500 ETF Trust
SPY,
the first and largest exchange-traded fund (with $360 billion in assets), which tracks the benchmark S&P 500
SPX,
That’s close to an all-time record, and the iPhone maker has a whopping 14.1% position in the Invesco QQQ Trust
QQQ,
which tracks the Nasdaq-100 Index
NDX,
Looking at the full Nasdaq Index
COMP,
which has 3,747 stocks, Apple takes a 13.5% position.

Apple now makes up 7.3% of the S&P 500 by market capitalization, close to the 8% record it set late in September.
FactSet
This is very much an Apple stock market, with the company topping the broad indexes that are weighted by market capitalization. You are likely to be invested in the company indirectly. You also might be feeling Apple’s impact in other ways. Apple’s App Store ecosystem drives more than $600 billion of annual revenue for developers.
Tim Cook’s tenure as Apple’s CEO has been nothing short of breathtaking when measured by the company’s financial performance. Apple is not one of the fastest-growing companies when measured by sales or earnings – it is too big for that. But its excellent stock performance has reflected Cook’s ability to deploy invested capital with improving efficiency. Cook has also been a market trendsetter in other important ways. He has Apple repurchasing $90 billion of its shares annually, setting the pace for stock buybacks in the market. Cook’s steady hand has also helped Apple withstand the market’s tech wreck and remain a stable pillar for the teetering Nasdaq Composite index generally. For all these reasons, Cook has earned a spot on the MarketWatch 50 list of the most influential people in markets.
Apple keeps improving by this important measure
Investors in the stock market are looking for growth over the long term. The best measure of that is whether or not a company’s share price goes up or down. But Cook isn’t just managing Apple’s stock. Digging a bit deeper into the company’s actual operating performance can provide some insight into what a good job Cook has done.
What should a corporate manager focus on? The stock price? How about the most efficient and most profitable way to provide goods and services? There are different ways to do this, and Apple has focused on quality, reliability and excellent service to build customer loyalty.
Apple’s commitment can be experienced by anyone who calls the company for customer service. It is easy to get through to a well-trained representative who will solve your problem. How many companies can say that at a time when it seems many companies cannot even handle answering the phone?
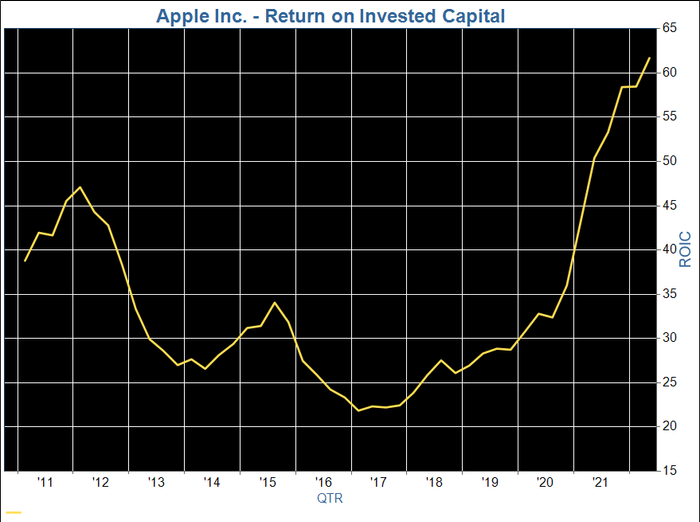
Getting back to actual performance, Cook took over as Apple’s CEO in August 2011 when Steve Jobs stepped down. This chart shows the company’s quarterly returns on invested capital from the end of 2010 through Sept. 2022:

Apple’s returns on invested capital have increased remarkable over the past six years under Tim Cook’s leadership.
FactSet
A company’s return on invested capital (ROIC) is its profit divided by the sum of the carrying value of its common stock, preferred stock, long-term debt and capitalized lease obligations. ROIC indicates how well a company has made use of the money it has raised to run its business. It is an annualized figure, but available quarterly, as used in the chart above.
The carrying value of a company’s stock may be a lot lower than its current market capitalization. The company mny have issued most of its shares long ago at a much lower share price than the current one. If a company has issued shares recently or at relatively high prices, its ROIC will be lower.
A company with a high ROIC is likely either to have a relatively low amount of long-term debt, or to have made efficient use of the borrowed money.
Among companies in the S&P 500 that have been around for at least 10 years, Apple placed within the top 20 for average ROIC for the previous 40 reported fiscal quarters as of Sept. 1.
As you can see on the chart, Apple’s ROIC has improved dramatically over the past five years, even as the wide adoption of the company’s products and services has led to an overall slowdown in sales growth.
A quick comparison with other giants in the benchmark index
It might be interesting to see how Apple stacks up among other large companies, in part because some businesses are more capital-intensive than others. For example, over the past four quarters, Apple’s ROIC has averaged 52.9%, while the average for the S&P 500 has been a weighted 12.1%, by FactSet’s estimate.
Here are the 10 companies in the S&P 500 reporting the highest annual sales for their most recent full fiscal years, with a comparison of average ROIC over the past 40 reported quarters:
| Company | Ticker | Annual sales ($mil) | Avg. ROIC – 40 quarters | Total Return – 10 Years |
| Walmart Inc. |
WMT, |
$572,754 | 11.0% | 142% |
| Amazon.com Inc. |
AMZN, |
$469,822 | 6.8% | 693% |
| Apple Inc. |
AAPL, |
$394,328 | 33.0% | 721% |
| CVS Health Corp. |
CVS, |
$291,935 | 6.8% | 161% |
| UnitedHealth Group Inc. |
UNH, |
$287,597 | 13.7% | 1,031% |
| Exxon Mobil Corp. |
XOM, |
$280,510 | 9.9% | 85% |
| Berkshire Hathaway Inc. Class B |
BRK.B, |
$276,094 | 8.2% | 233% |
| McKesson Corp. |
MKC, |
$263,966 | 6.6% | 353% |
| Alphabet Inc. Class A |
GOOGL, |
$257,488 | 16.6% | 405% |
| Costco Wholesale Corp. |
COST, |
$226,954 | 16.2% | 558% |
| Source: FactSet | ||||
Among the largest 10 companies in the S&P 500 by annual sales, Apple takes the top ranking for average ROIC over the past 10 years, while ranking second for total return behind UnitedHealth Group Inc.
UNH,
and ahead of Amazon.com Inc.
AMZN,
UnitedHealth has been able to remain at the forefront of managed care during the period of transition for health care in the U.S., in the wake of President Obama’s signing of the Affordable Care Act into law in 2010.
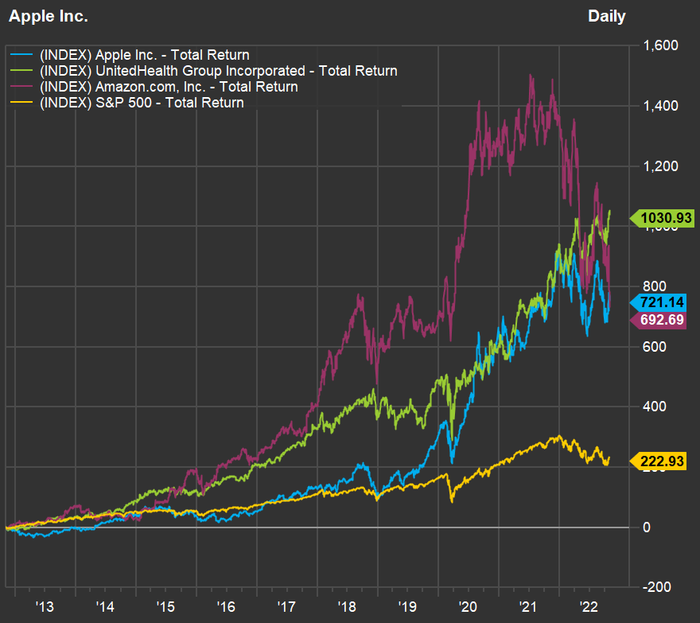
Here’s a chart showing 10-year total returns for Apple, UnitedHealth Group, Amazon and the S&P 500:

FactSet
Apple is only slightly ahead of Amazon’s 10-year total return. But what is so striking about this chart is the volatility. Apple has had a smoother ride. During the bear market of 2022, Apple’s stock has declined 18%, while the S&P 500 has gone down 20%, the Nasdaq has fallen 32% (all with dividends reinvested) and Amazon has dropped 45%.
The broad indexes would have fared even worse so far this year without Apple.
TO SEE THE FULL MARKETWATCH 50 LIST CLICK HERE

