
U.S. stocks kicked off the fourth quarter with sharp gains as the Dow Jones Industrial Average
DJIA,
appears headed for its biggest two-day rally in more than 2½ years.
But as tempting as it might be to call a bottom in stocks, Nicholas Colas, co-founder of DataTrek Research, said Tuesday that investors should brace for more carnage in the near term as several reliable historical signs of a durable bottom are still missing from markets.
Valuations are still too high, Colas said, and although 2022 has seen immense two-way volatility in stocks, sharp moves higher historically tend to signal that more volatility might be in store for stocks.
See: Wall Street’s ‘fear gauge’ still not signaling stock-market bottom is near, analysts say
“Happy as we are that U.S. equities had a nice bounce today, this move is best considered as just another day in a rough year,” Colas said.
While they have been extremely common since the start of 2022, historically speaking, single-session advances of 2% or more are a relative rarity for markets. Since 2013, years that contained fewer single-day advances of 2% or more tended to result in stronger performance over the course of the year, Colas said.
The one exception to this was 2020, when the S&P 500 registered 19 daily gains of 2% or more. However, Colas argued that most of these outsize moves occurred during the first half of the year, when markets were still reeling from the onset of the COVID-19 pandemic.
During the second half of the year, the S&P 500 saw exaggerated moves in only two sessions, as Colas shows in the chart below, using data from DataTrek.
| Year | S&P 500 Total Return | No. of days with 2%+ moves |
| 2013 | +32% | 1 |
| 2014 | +14% | 2 |
| 2015 | +1% | 3 |
| 2016 | +12% | 4 |
| 2017 | +22% | 0 |
| 2018 | -4% | 4 |
| 2019 | +31% | 2 |
| 2020 | +18% | 19 (but only 2 during H2) |
| 2021 | +28% | 2 days |
| 2022 | -22.8% (price move through Monday without dividends reinvested) | 14 days |
“Simply put, strong 1-day S&P rallies (+2%) are NOT the sign of a healthy market,” Colas wrote.
How do we know the bottom is in?
In the past, when long-term bottoms have arrived, stocks have typically greeted them with a large intraday move of at least 3.5%. This held true for the cycle lows that arrived in October 2002, March 2009 and March 2020.
Based on this benchmark, Monday’s bounce wasn’t large enough to signal a meaningful turning point.
| Day after cycle low | S&P 500 performance |
| Oct. 10, 2002 | +3.5% |
| March 10, 2009 | +6.4% |
| March 24,2020 | +9.4% |
| Average | +6.4% |
Valuations are still historically rich
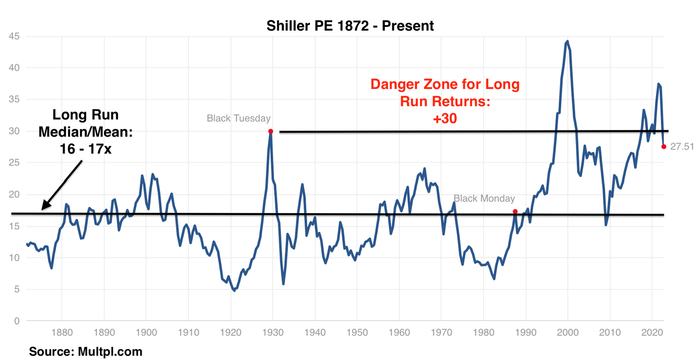
Colas also argued that stocks are still relatively richly valued based on a popular measure of cyclically adjusted equity valuations.
Instead of using forward earnings expectations, or trailing 12-month earnings, the Shiller ratio is based on the inflation-adjusted average of corporate earnings over the past 10 years.
According to the Shiller PE ratio, the long-run mean valuation for stocks dating back to the 1870s is between 16 times and 17 times cyclically-adjusted earnings. As of Friday, the S&P 500 — which was created in 1957 — was trading at 27.5 times earnings, and after Monday’s rally, it was trading at 28.2 times, Colas said.
Does this mean stocks are now cheap enough to warrant buying? That depends on one’s macro view, Colas said. But the only thing investors can be certain of is that stocks have exited the valuation “danger zone” north of 30 times average adjusted long-term earnings.
DATATREK
What about the VIX?
The last two protracted periods of market weakness offer some insights about how movements in the Cboe Volatility Index, also known as the VIX,
VIX,
might play out as investors try to anticipate when the ultimate market bottom might arrive.
During the 2020-2021 dot-com blowup, the VIX “experienced a series of rolling spikes that ground away at market confidence and valuations.” Ultimately, it took 2½ years for stocks to bottom out after prices peaked in March 2000.
By comparison, after the financial crisis in 2008, markets bottomed out more quickly — but not before the VIX reached a peak above 80, more than double its intraday high from June.
“As painful as it might be over the next few months, long term investors could not be blamed for hoping that 2022 looks more like 2007 – 2009 than 2000 – 2002,” Colas said.
U.S. stocks are headed for back-to-back gains on Tuesday, with the S&P 500
SPX,
up 2.9% to 3,784, the Dow Jones Industrial Average
DJIA,
up 2.6% at 30,258 and the Nasdaq Composite
COMP,
up 3.3% to 11,174.
Market strategists have attributed the rebound in stocks to a pullback in bond yields stoked by expectations that the Fed may need to “pivot” toward a less aggressive interest-rate hikes.
Neil Dutta, head of U.S. economic research at Renaissance Macro Research, said in a note to clients Tuesday that the Reserve Bank of Australia’s smaller-than-expected interest-rate hike overnight marked the latest in a series of “wins” for investors betting on a Fed “pivot.”
“This is great, but in the back of my mind I am thinking, this can’t possibly last,” Dutta wrote.
Read: What does a pivot look like? Here’s how Australia’s central bank framed a dovish surprise.
Colas told his clients last week that the VIX would need to close above 30 for at least a few consecutive sessions before a “tradable” rebound could arrive.
See: Wall Street’s ‘fear gauge’ might hold the key to the timing of the next market rebound. Here’s why.
That call ended up being correct. But unfortunately, the close above 40 on the VIX that Colas has been waiting for since spring has yet to arrive.


